What if every month, you had an simple Actionable-Brief that told you this…
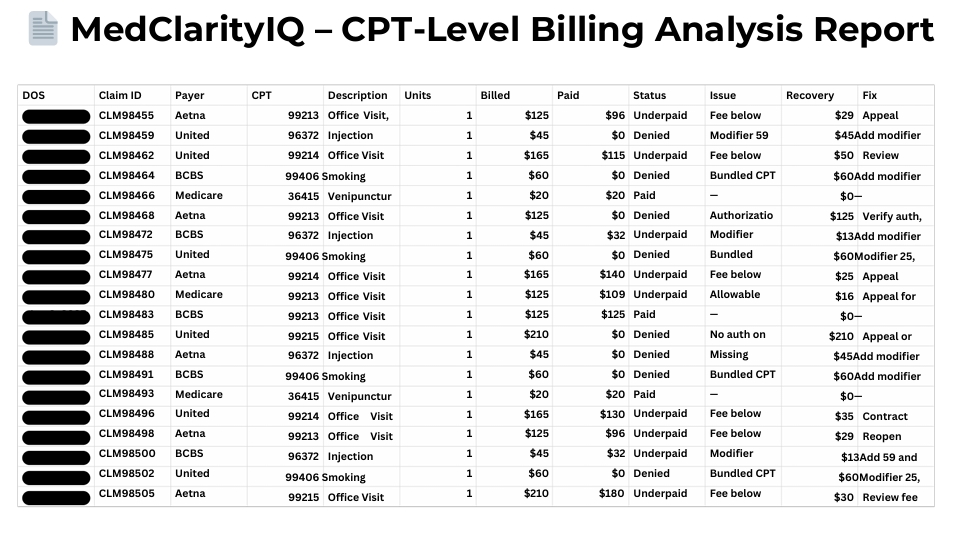
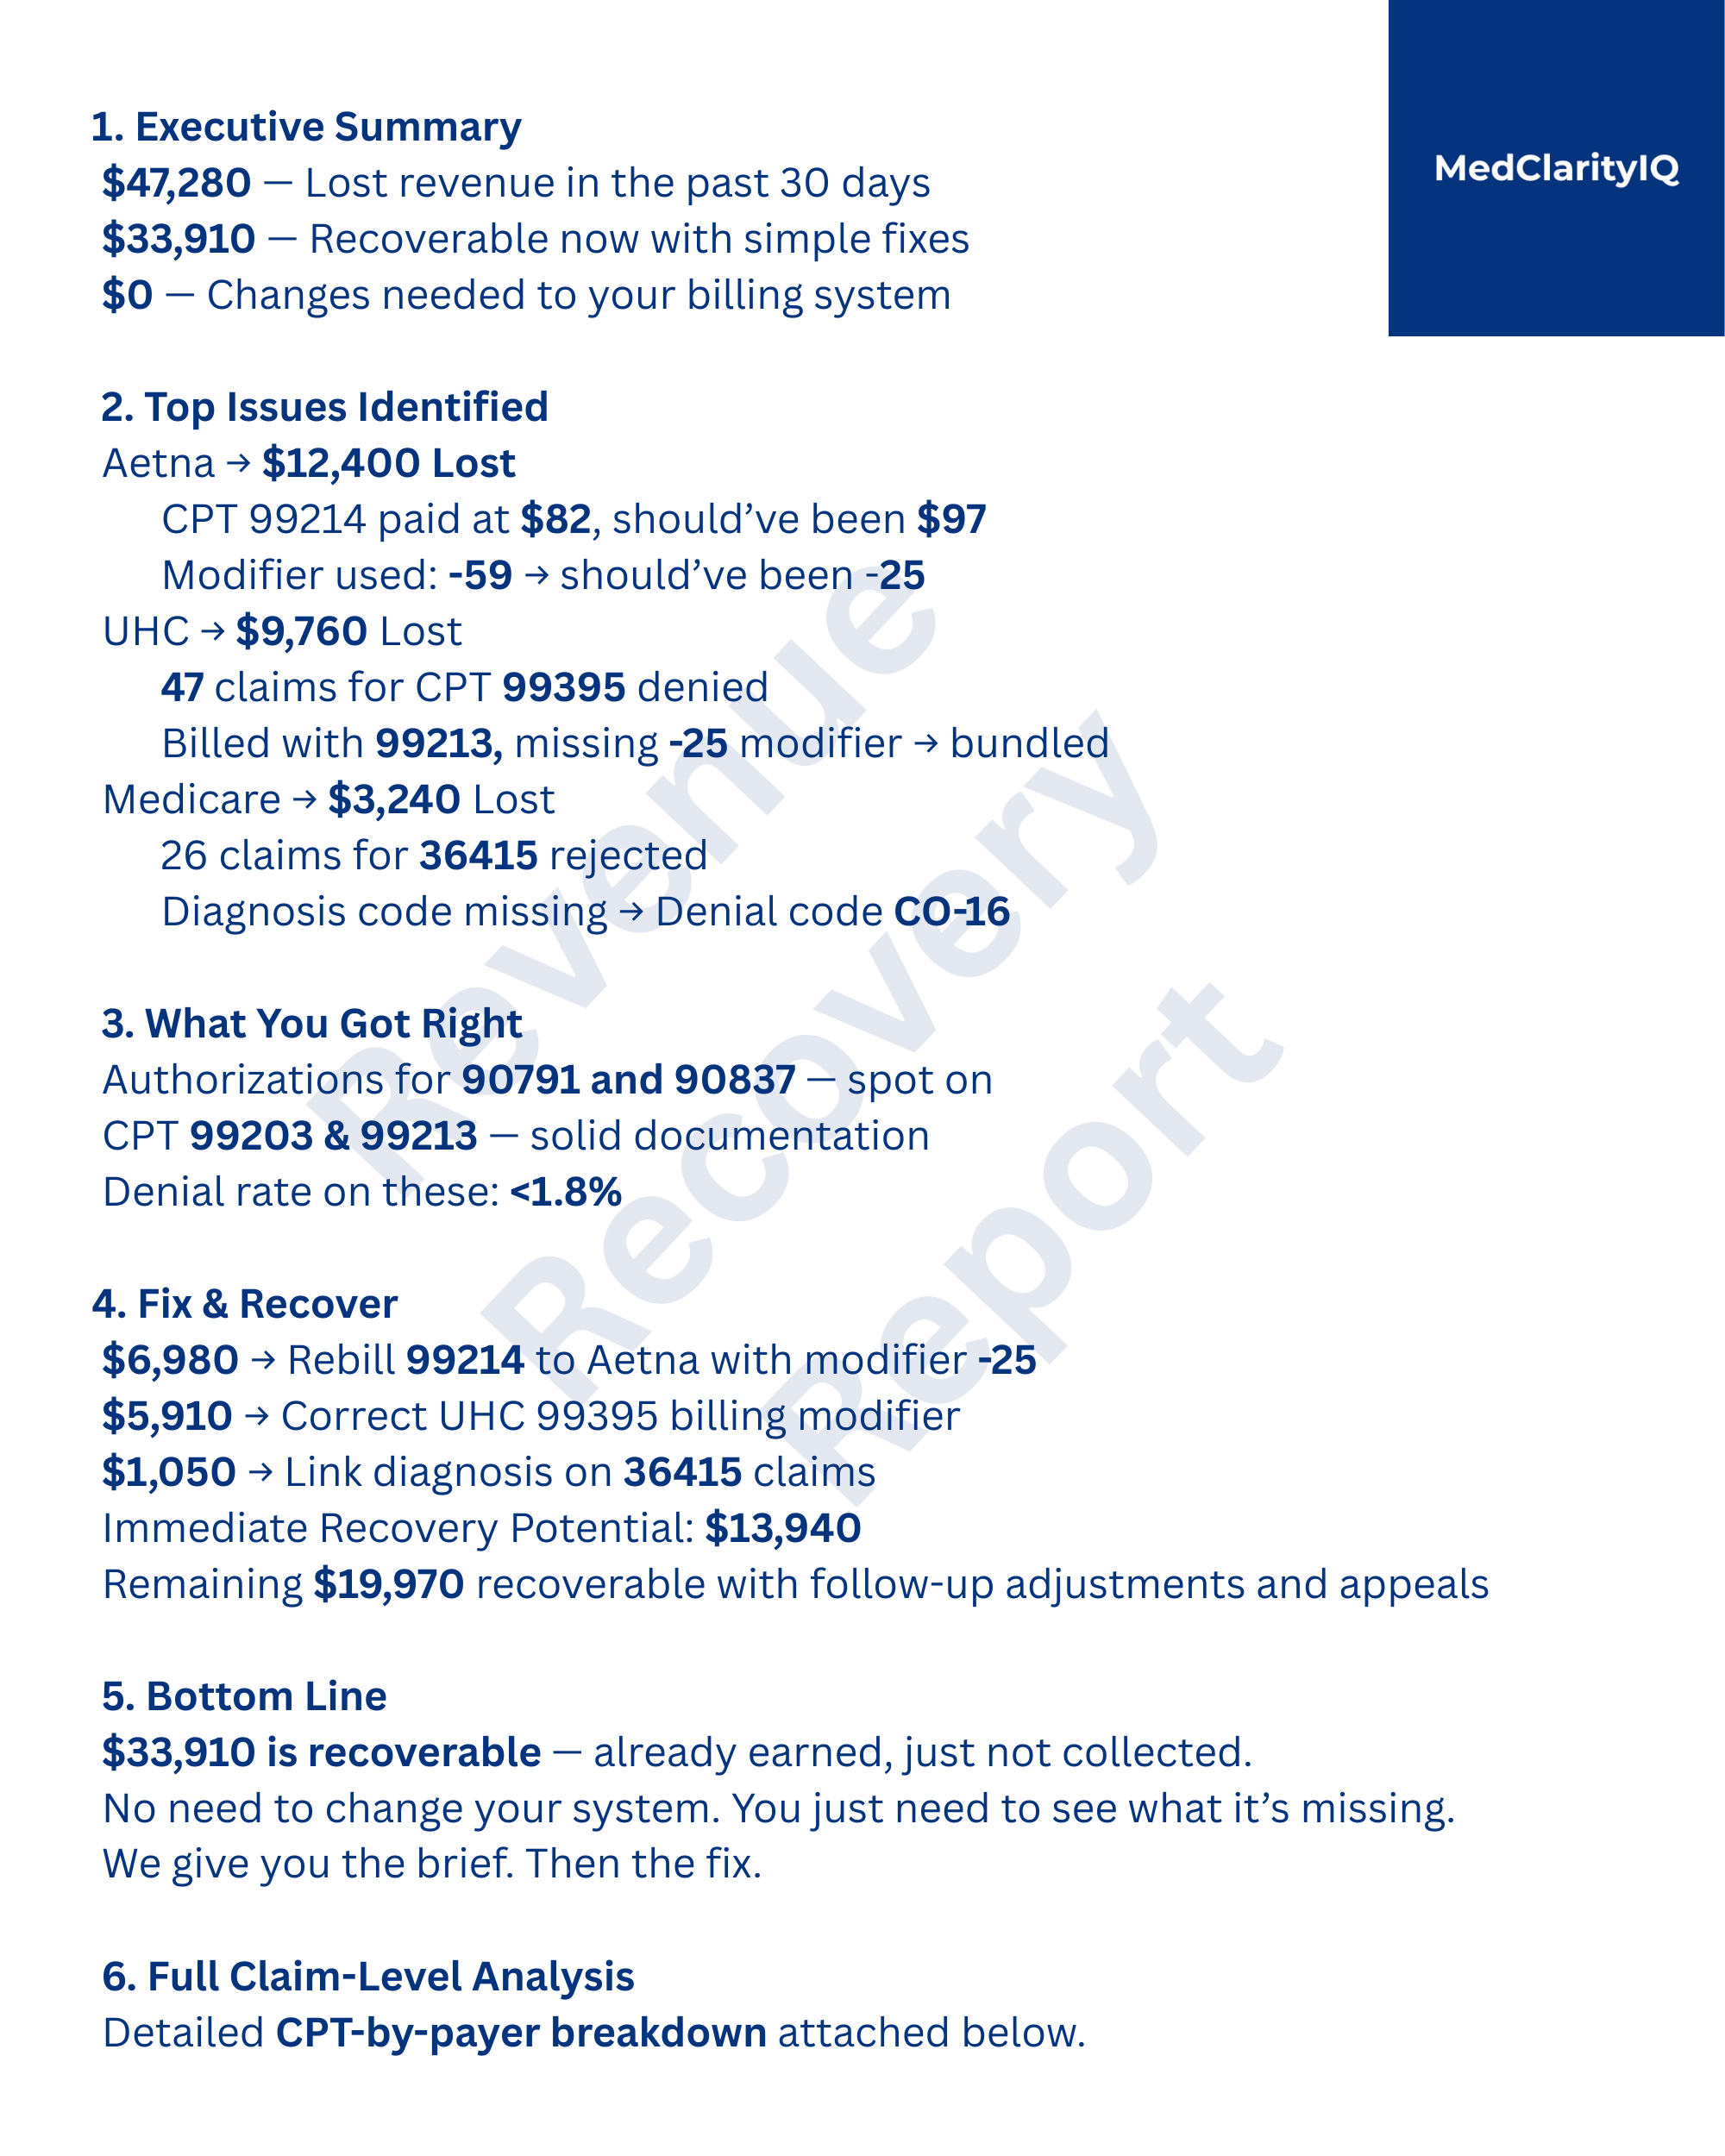
👉 How much revenue your clinic lost
👉 Why it happened
👉 And how to fix it — claim by claim
And it was completely free? Sounds good, right?
👉 How much revenue your clinic lost
👉 Why it happened
👉 And how to fix it — claim by claim
And it was completely free? Sounds good, right?
They thought they were being paid fairly — until we showed them Aetna and UHC were silently shortpaying for months. Their billing team never saw it coming.